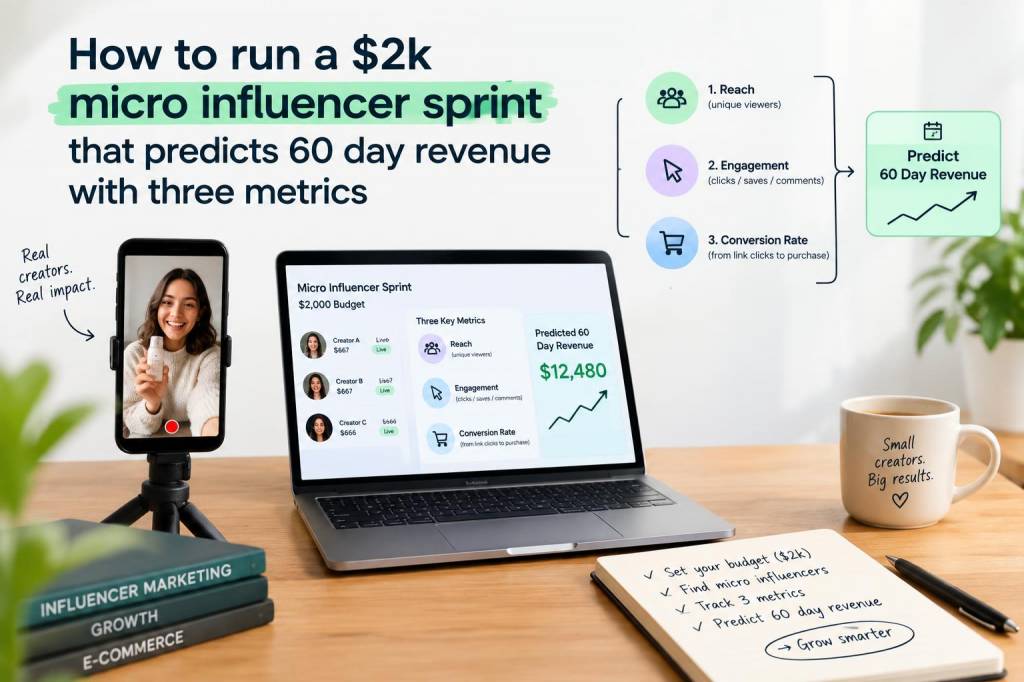
I run small, tightly controlled influencer experiments all the time. When I tell people I can predict 60-day revenue from a $2,000 micro-influencer sprint using just three metrics, they often assume it’s smoke and mirrors. It’s not. It’s disciplined measurement, simple math, and an understanding of how influence converts over time. Below I’ll walk you through the exact setup I use, the three metrics that matter, how to forecast revenue, and practical steps to run a $2k sprint that gives you a reliable 60-day revenue projection.
Why a micro-influencer sprint works
Micro-influencers (5k–50k followers) offer high engagement and authentic recommendations—exactly what you want when testing product-market fit or creative messaging. With $2,000 you can run a short, focused experiment across multiple creators to collect meaningful data without over-indexing on vanity metrics.
My goal with a sprint is not to max out reach but to produce a statistically useful signal: does this channel + creative + offer produce sales? To do that I focus on three actionable metrics that, when combined, predict revenue with surprising accuracy.
The three metrics I use
- CTR (Click-Through Rate) — clicks on tracked links divided by impressions. This tells me how compelling the creative+CTA is.
- Conversion Rate (CVR) — purchases divided by clicks using the tracked link or promo code. This captures the on-site performance and offer strength.
- AOV (Average Order Value) — average purchase value from traffic driven by the influencers.
Those three metrics form the funnel: Impressions → Clicks (CTR) → Purchases (CVR) → Revenue (AOV). Because influencer effects can be delayed, I track purchases up to 60 days after the sprint starts. That’s how you get the 60-day revenue projection.
Sprint design: how I spend $2,000
Here’s my usual allocation. I’m explicit about this because budget discipline matters—don’t pour the whole $2k into one creator unless you’re testing that creator specifically.
| Line item | Amount | Purpose |
|---|---|---|
| Creator fees (4–6 micro-influencers) | $1,200 | Diversify risk and test creative variations |
| Promo codes & discount | $200 | Drive conversions and track attributable sales |
| Creative production & boost (ads to the posts) | $300 | High-quality assets and small paid amplification |
| Tracking & tools (UTM, link shorteners, analytics) | $100 | Proper attribution setup |
| Contingency / bonus for performance | $200 | Incentive for creators if posts hit KPIs |
Selecting creators and offers
I look for creators whose audience aligns with my buyer persona and who have strong engagement (likes and comments relative to follower count). I prefer creators who’ve worked with ecommerce brands and can produce a clear CTA—either a swipable story, link in bio, or unique promo code.
My offer is simple: a time-limited 10–20% discount or a gift-with-purchase. Why simple? Complicated offers confuse viewers and depress conversion rates. The offer also enables me to track conversions with a unique promo code per creator and UTM-tagged links for click-level insight.
Tracking setup (non-negotiable)
- I use UTM parameters on all links to attribute clicks to creator and creative.
- I create a unique promo code per creator so I can see purchases reported by source in my ecommerce platform (Shopify, WooCommerce, etc.).
- I ensure Google Analytics / GA4 tracks sessions and conversions, and I capture click-to-conversion timelines.
If you skip any of these, you’ll be guessing. I treat each creator as a mini-ad channel and measure CTR, CVR, and AOV per creator.
How to run the sprint (timeline)
- Week 0 — Prep: select creators, confirm posts, set up promo codes and UTMs, design trackable landing page or product tag.
- Week 1 — Launch: creators publish content over 3–5 days; monitor CTR and early conversions daily.
- Week 2–8 — Observe: continue to track conversions from UTMs and promo codes up to day 60.
- Week 9 — Analyze: combine data to forecast revenue and decide whether to scale.
Forecasting 60-day revenue: the math I use
This is the simple, repeatable formula I run for each creator and in aggregate.
Projected Revenue (60 days) = Impressions × CTR × CVR × AOV × Attribution factor
The Attribution factor accounts for purchases that happen after the sprint but still within the 60-day window (I calculate it from historical decay — often 1.2–1.4 if I see delayed conversions). If you don’t have historical decay, use 1.2 as a conservative estimate.
Example with conservative inputs from a single creator:
- Impressions: 50,000
- CTR: 1.5% → 0.015
- CVR: 3% → 0.03
- AOV: $60
- Attribution factor: 1.2
Clicks = 50,000 × 0.015 = 750
Purchases = 750 × 0.03 = 22.5 → round to 22
Revenue (60 days) = 22.5 × $60 × 1.2 = $1,620
If that creator cost you $300, your net (before product cost) looks promising. Run this across all creators in the sprint and you have an aggregate 60-day revenue projection.
Interpreting results and thresholds I care about
I’ve set internal benchmarks that help me decide whether to scale after the sprint. They may change by category, but here are the ones I use:
- If CTR < 0.5% across creators, creative or audience fit is likely poor — kill or pivot creative.
- If CVR < 1.5% from influencer traffic, landing page or offer needs work.
- If AOV is significantly lower than site average, consider bundling or upsell flows.
- My minimum target ROI for scaling: predicted revenue should be at least 2–3x the influencer spend within 60 days, after accounting for cost of goods and returns.
Examples from campaigns I’ve run
Recently I ran a $2k sprint for a DTC skincare brand. We used four creators (two beauty micro-influencers, one wellness micro-creater, one lifestyle micro-influencer). Our aggregated metrics:
- Impressions: ~190,000
- Avg CTR: 1.2%
- Avg CVR: 2.8%
- AOV: $48
- Attribution factor: 1.3
Projected 60-day revenue = 190,000 × 0.012 × 0.028 × $48 × 1.3 ≈ $6,248. The actual tracked attributable revenue after 60 days was $6,010 — close enough to be actionable. We scaled by increasing top-performing creators’ budgets and creating lookalike audiences from the clickers for paid social.
How to scale after a successful sprint
- Double down on creators with the highest CTR×CVR per dollar spent.
- Repurpose creator content into paid social assets (stories into ads, UGC into carousel ads).
- Create segmented follow-up flows: retarget clickers who didn’t buy with abandoned-cart or “still thinking?” offers.
- Test expanding offers or slightly higher AOV bundles to increase LTV.
Common pitfalls and how I avoid them
1) Chasing impressions over signal. I focus on CTR and CVR, not follower count. A 10k follower creator with 3% CTR beats a 50k creator with 0.3% CTR every time.
2) Poor tracking. If promo codes and UTMs aren’t correctly implemented, you’re flying blind. I triple-check tracking before launch.
3) Misattributing long-tail sales. Always use the 60-day window and an attribution factor to account for delayed purchases.
4) Ignoring creative fatigue. I stagger posts across creators and request slightly different angles to avoid repeated messaging that cannibalizes performance.
If you want, I can help you sketch a sprint for your product—creator selection, exact UTMs to use, and a forecast model built from your average AOV and margin. I run these blueprints for brands all the time, and a $2k sprint can be the most clarifying marketing spend you make this quarter.