Running a 7-day ad test is one of my favorite sanity checks when launching a new campaign. It’s short enough to move quickly, but long enough to collect meaningful signals—if you know what to look for. Over the years I’ve learned that the temptation to chase impressions or vanity metrics can derail predictive insights. Instead, you want a small set of reliable indicators that help you forecast whether the campaign will be profitable once scaled.
How I frame a 7-day test
Before any pixel fires or budgets are transferred, I define three things: the goal (what “profitability” means for this test), the acceptable CPA or ROAS threshold, and the minimum sample size or conversions I need to judge performance. For ecommerce that might be a target ROAS of 3x; for B2B lead gen it could be a target CPL and a required lead-to-opportunity conversion rate.
Once those are set, I split my measurements into four buckets: ad-level signals (creative and placement), traffic-quality signals (engagement on landing pages), conversion signals (actions that map to revenue), and efficiency/scale signals (what happens if we increase spend). These buckets guide what I monitor day-by-day.
Primary metrics I measure in days 1–7
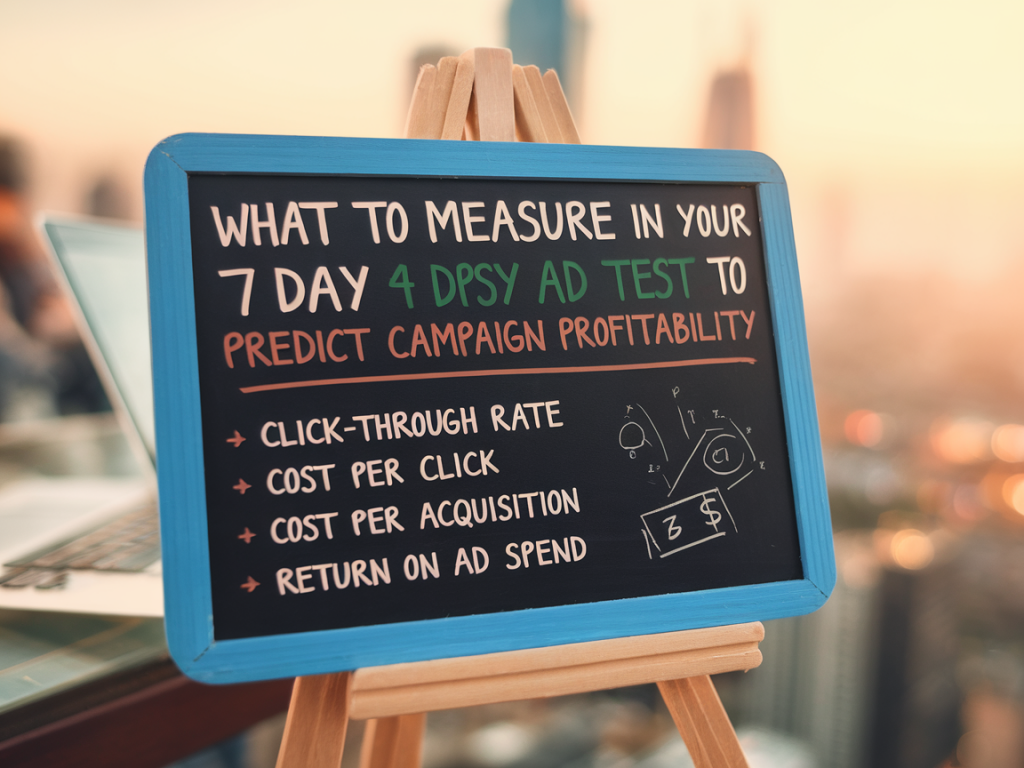
Below are the KPIs I check during and at the end of a 7-day test, why they matter, and the minimum thresholds or red flags I watch for.
| Metric | Why it matters | Signals / Thresholds I watch |
|---|---|---|
| Impressions & CPM | Shows reach and auction competitiveness. | High CPM + low clicks = poor creative or wrong audience. Sudden CPM spike needs investigation. |
| CTR (Click-through rate) | Early signal of creative relevance. | Healthy CTR varies by channel; on Facebook ~0.5–1%+ is often decent for cold traffic. Low CTR = fix creative or audience. |
| CPC | Efficiency of traffic acquisition. | If CPC is much higher than modelled, profitability likely under pressure. |
| Landing page conversion rate (CVR) | Measures traffic quality and LP experience. | Low CVR with good CTR = landing page problem. High bounce rate is a red flag. |
| Cost per Acquisition (CPA) | Directly tied to your profitability target. | If CPA is within target by day 5–7, it’s a positive sign; if not, you need to understand why. |
| ROAS (or margin-adjusted ROAS) | Best early predictor of profit for ecommerce. | Calculate gross margin into ROAS for realism. A 7-day ROAS below target is concerning unless LTV explains ramp. |
| Conversion count & statistical confidence | Enough conversions reduce noise and variance. | I aim for at least 20–50 conversions per variant for directional decisions; use Bayesian or frequentist checks. |
| Frequency | Ad fatigue risk; impacts CTR and CVR over time. | Frequency >2–3 (cold) in 7 days often signals creative swap needed. |
| Quality metrics (engagement, bounce, time-on-site) | Helps explain conversion issues beyond ad metrics. | High bounce + short session = mismatch between ad promise and landing page. |
What I track daily vs. end-of-test
Daily checks: impressions, CPM, CTR, CPC, spend pacing, frequency, and any platform warnings (rejections, policy issues). I watch creative performance—if one creative outperforms others consistently, I reallocate budget.
End-of-test deeper analysis: CVR, CPA, ROAS, conversion distribution by time and by placement, audience overlap, and channel-specific attribution. I also export raw click and conversion logs to inspect paths and anomalies (e.g., a user clicking multiple times or conversions occurring outside expected windows).
How I use small-sample signals to predict profitability
A 7-day window won’t tell you final LTV, but it will tell you whether the funnel behaves reasonably. I focus on three predictive relationships:
Example: CPC = £0.60, CVR = 1.5% → CPA = £40. If your average order value (AOV) is £100 with 50% gross margin, breakeven CPA ≈ £50, so at £40 CPA you’re likely profitable once fixed costs are accounted for.
Practical steps I follow during a 7-day test
Signals that make me pause scaling
I’ll stop and diagnose if I see any of the following during the 7-day test:
When to be more patient
Some campaigns take longer to stabilize—especially prospecting campaigns relying on learning algorithms (Facebook, Google). If the platform indicates it’s still “learning” and conversion costs are improving each day, I give it the full 7 days. For expensive conversions (high-ticket or long-form sales), I may extend to 14–21 days but still use the 7-day window to identify fatal flaws quickly.
Final practical checklist I run at day 7
Running short tests well is a mix of math, product knowledge, and attention to signals beyond raw conversions. If you measure the right things in the right order—creative signal, traffic quality, funnel conversion math—you’ll avoid common traps and make better decisions about which campaigns to scale and which to rework.